The Analytics Panel is an information management and data visualization tool that allows you to analyze platform usage indicators and monitor messages from Zenvia's tools and channels.
In this article, we detail the features of message traffic tracking and teach you how to use this tool.
Message traffic per channel
On Zenvia Platform home page, you will find the Message traffic box. It shows the number of messages sent and received per channel in the month up to the current date and time of the query.
In the example, the number of WhatsApp messages sent and received in April up to the 25th at 12:47 PM was 5,563,629.
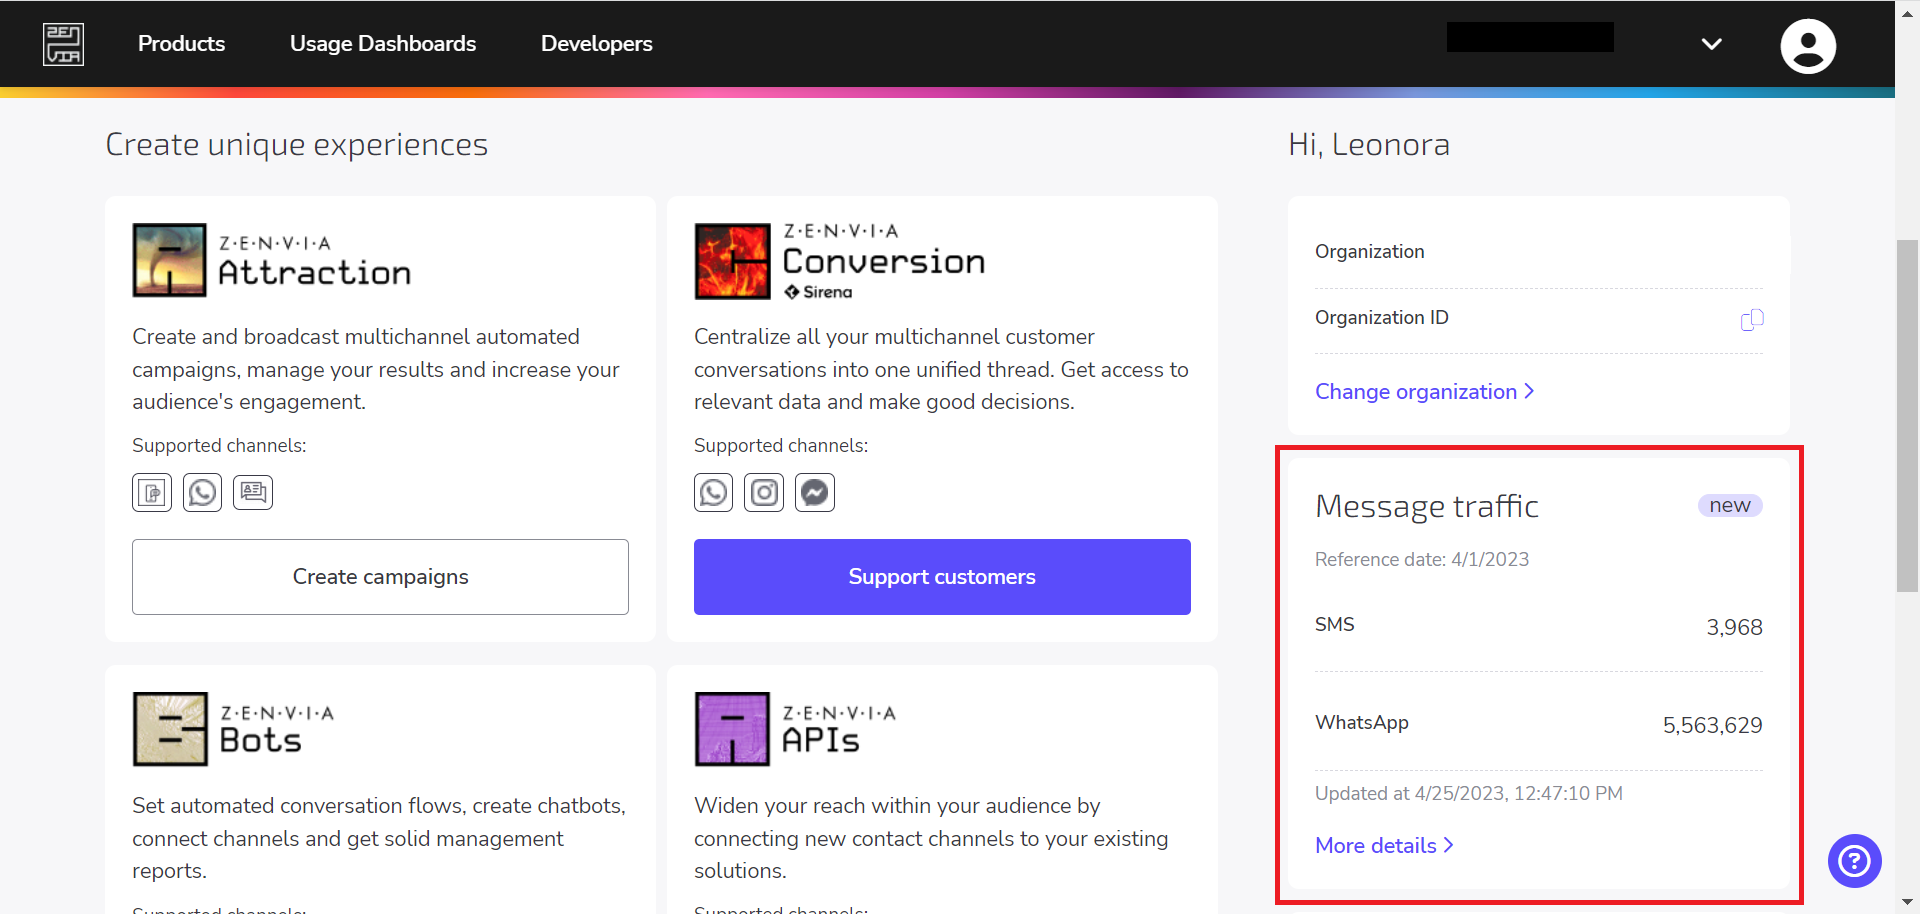
The data is updated automatically. To see more information about your message traffic, click More details. You go to the Analytics Panel.
Accessing the Analytics Panel
Another way to acess the Analytics Panel is to click Usage Dashboards > Analytics Panel option on the Zenvia platform's home page.
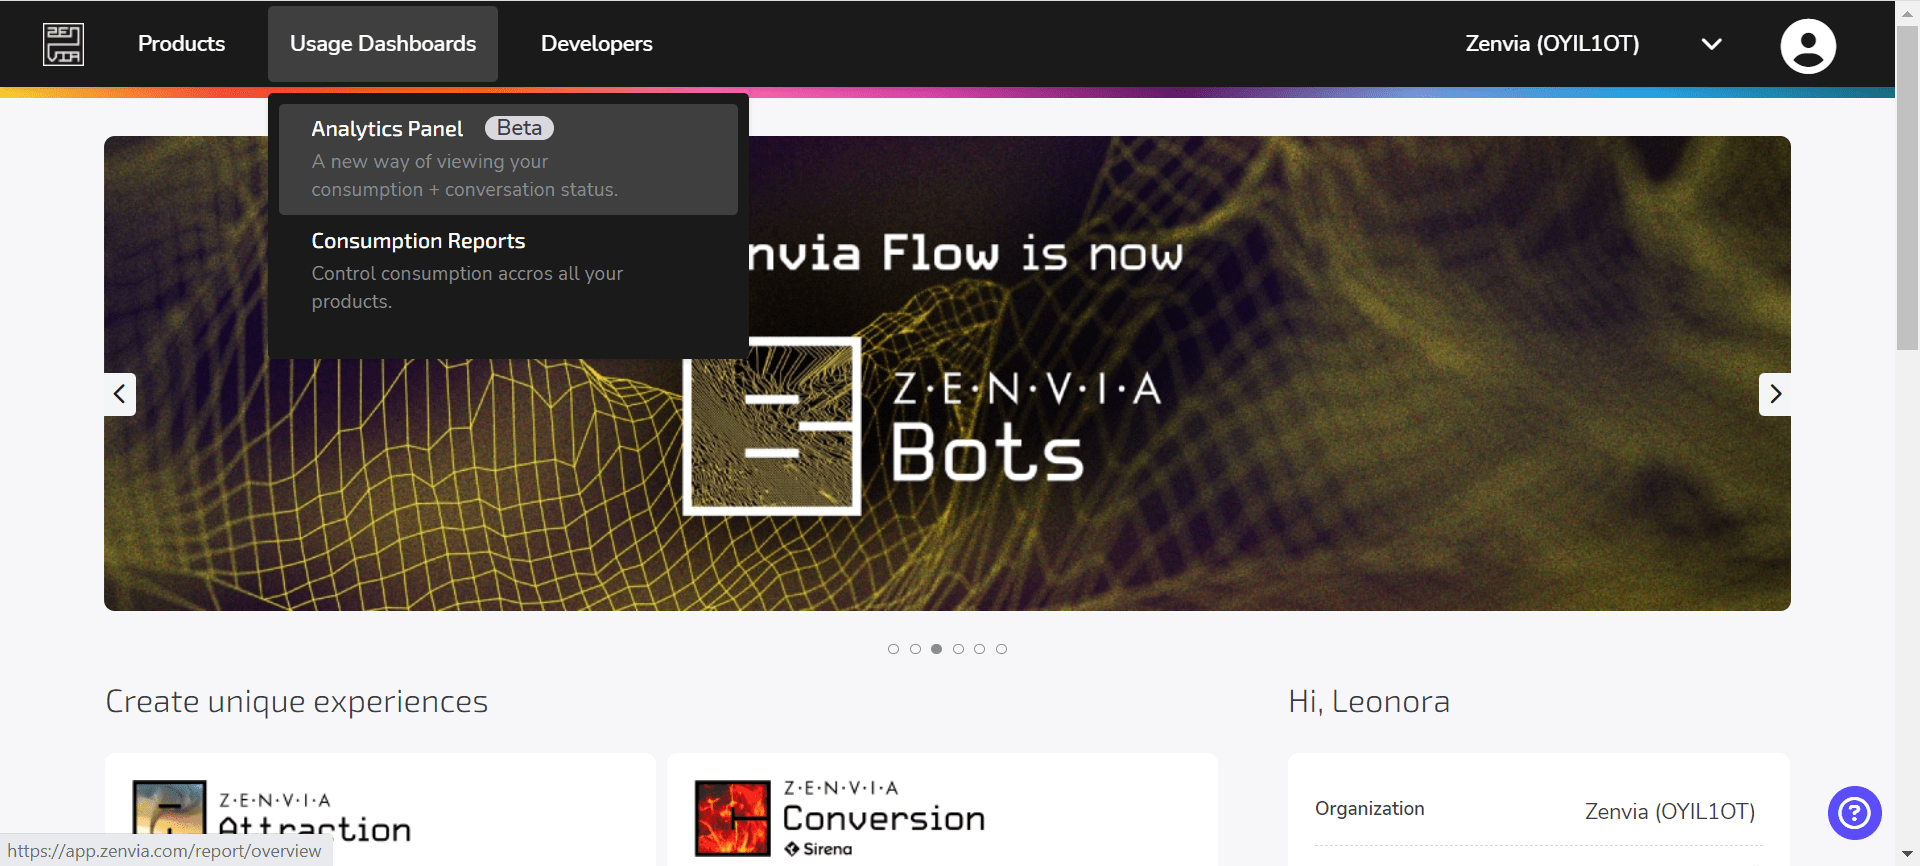
The tool is displayed with the supported products and channels.
Which products are supported?
- Zenvia APIs;
- Zenvia Attraction;
- Zenvia Chat;
- Zenvia Bots.
Which channels are supported?
- Chat;
- Custom;
- E-mail;
- Facebook Messenger;
- GBM;
- Instagram;
- RCS
- SMS;
- Telegram;
- Voice;
- WhatsApp.
To analyze platform usage indicators and monitor the messages of Zenvia's tools and channels, it is necessary to apply the period and product filters that you want to obtain information.
Filtering data
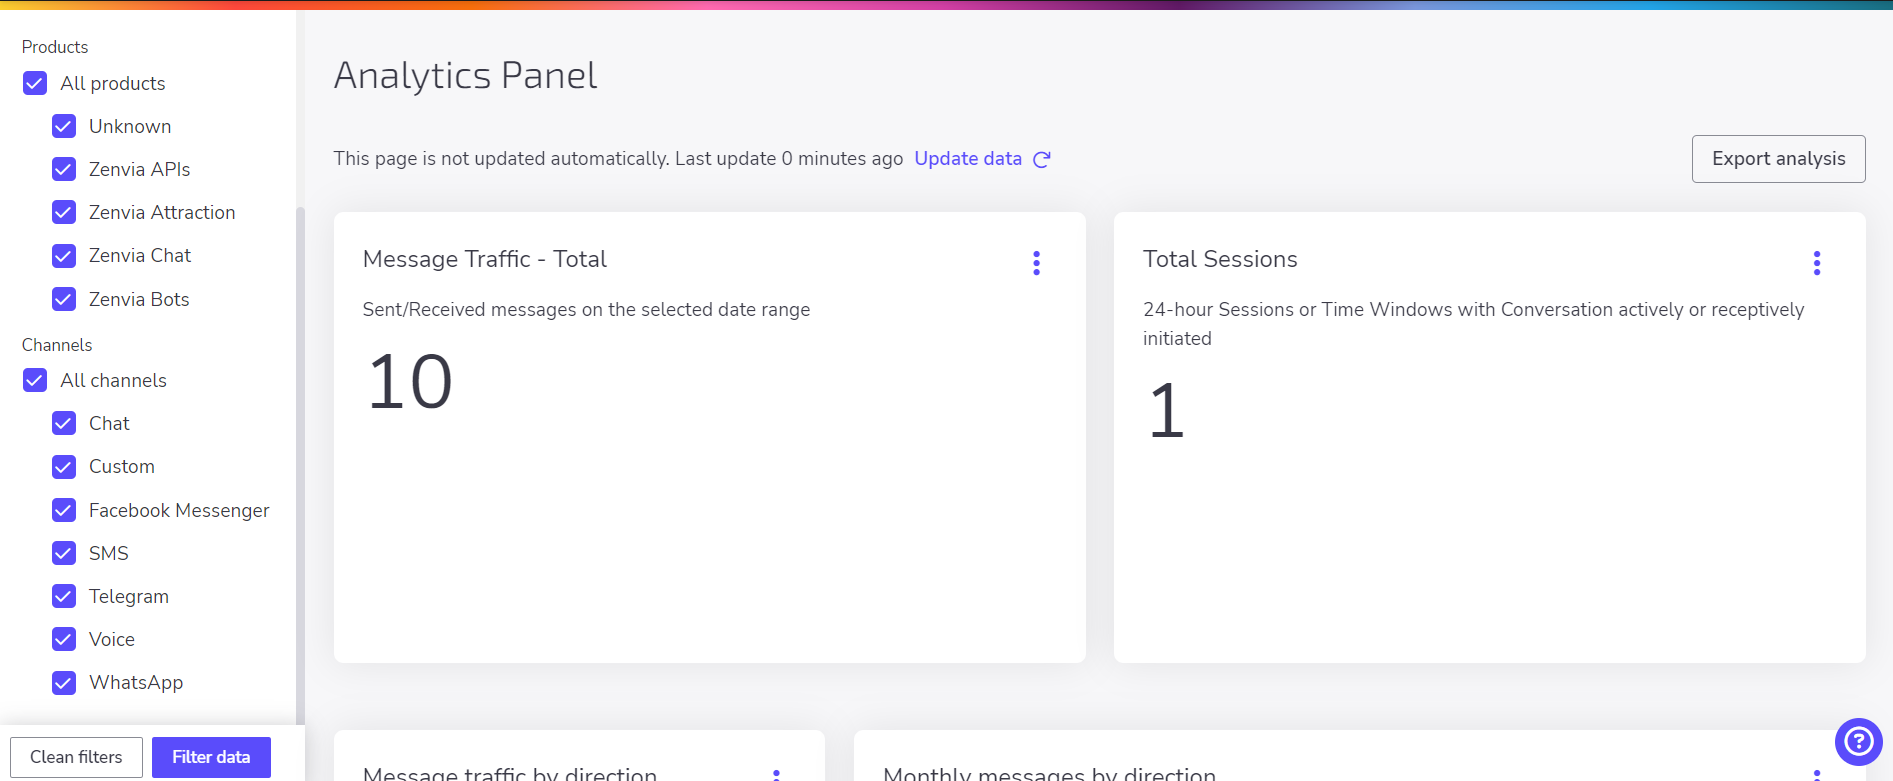
You can filter the data using the following markers:
- Time period: Determine the time range of the analysis.
- Products: Choose the Zenvia products for analysis.
- Channels: Choose the communication channels for analysis.
⚠️ Attention: The Unknown filter in the Products field means that in certain situations metrics are not linked to a product. A possible cause for this problem is messages received without treatment, for example, a contact answers messages after finishing a Zenvia Bots flow. Another cause is partial support of the product(s) in the Analytics Panel.
Once you select the desired filters, click Filter data.
The data is displayed according to the selected filters. To remove the applied filters, click Clean filters.
Now, let's learn how indicators work.
Indicators
Indicators are simplified representations of platform metrics, used to facilitate their interpretation. In the Analytics Panel, metrics are the units of usage and monitoring messages collected by the system.
The Analytics Panel shows the following indicators:
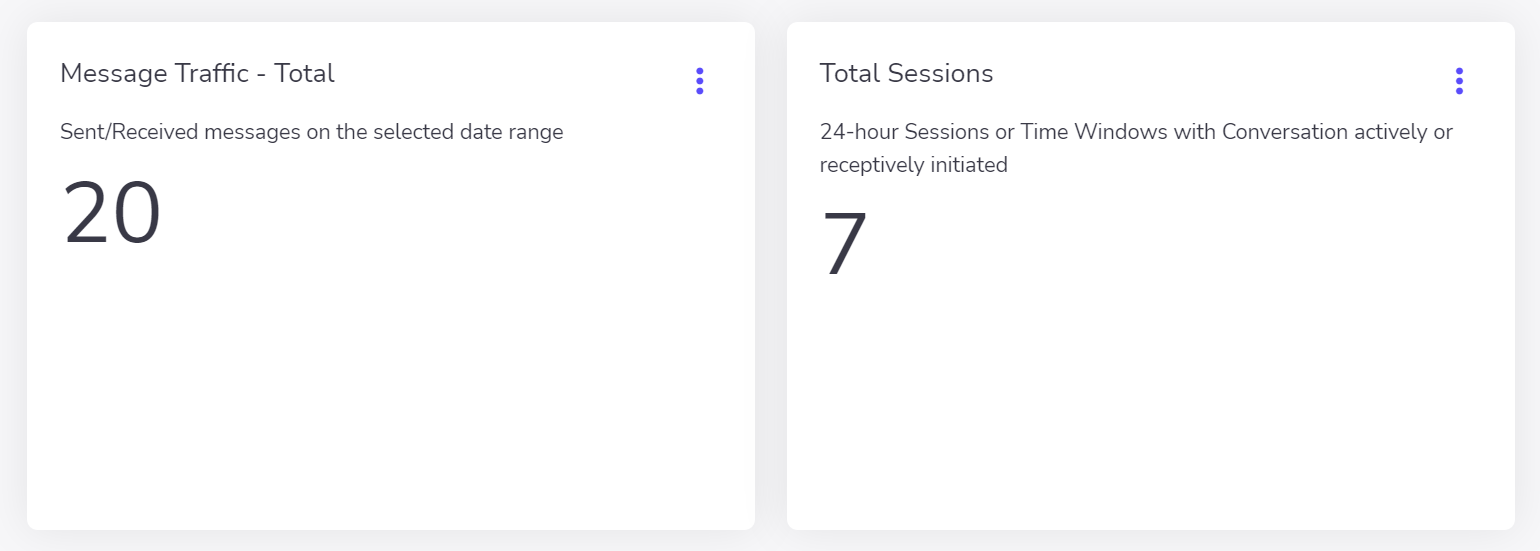
- Message traffic - Total: Messages sent and received in the selected period.
- Total sessions: 24-hour windows or sessions with actively or receptively initiated conversation.
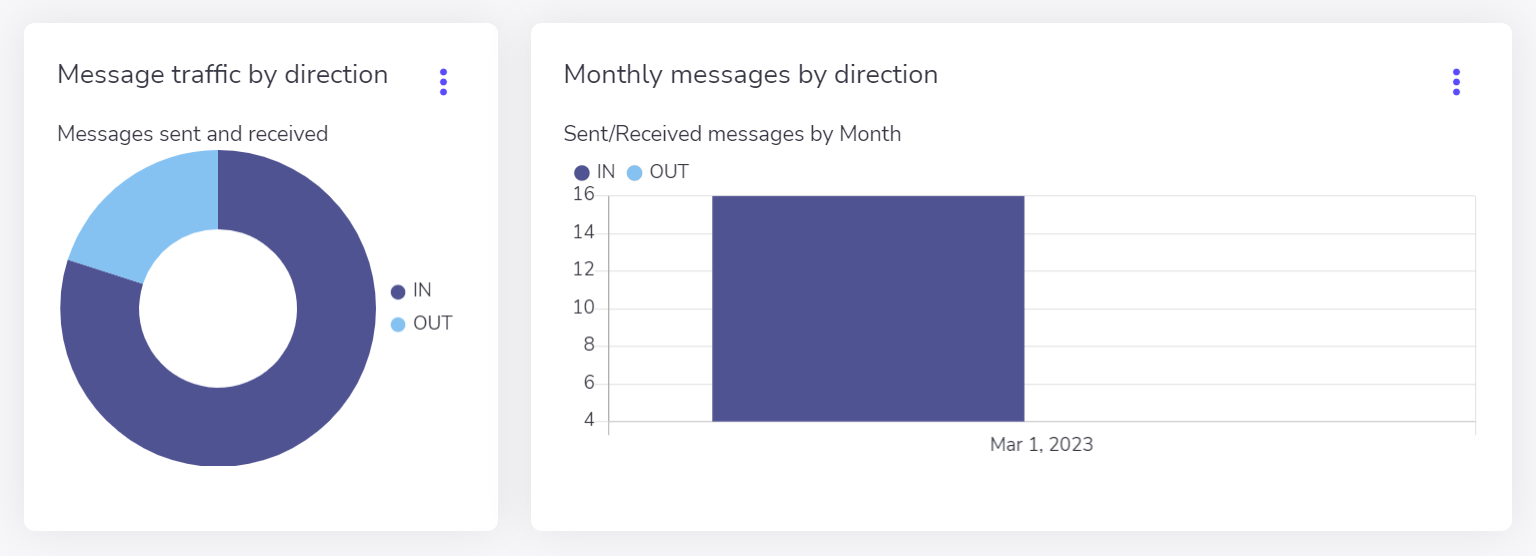
- Message traffic by direction: Messages sent and received in the selected period.
- Monthly messages by direction: Messages sent and received per month.
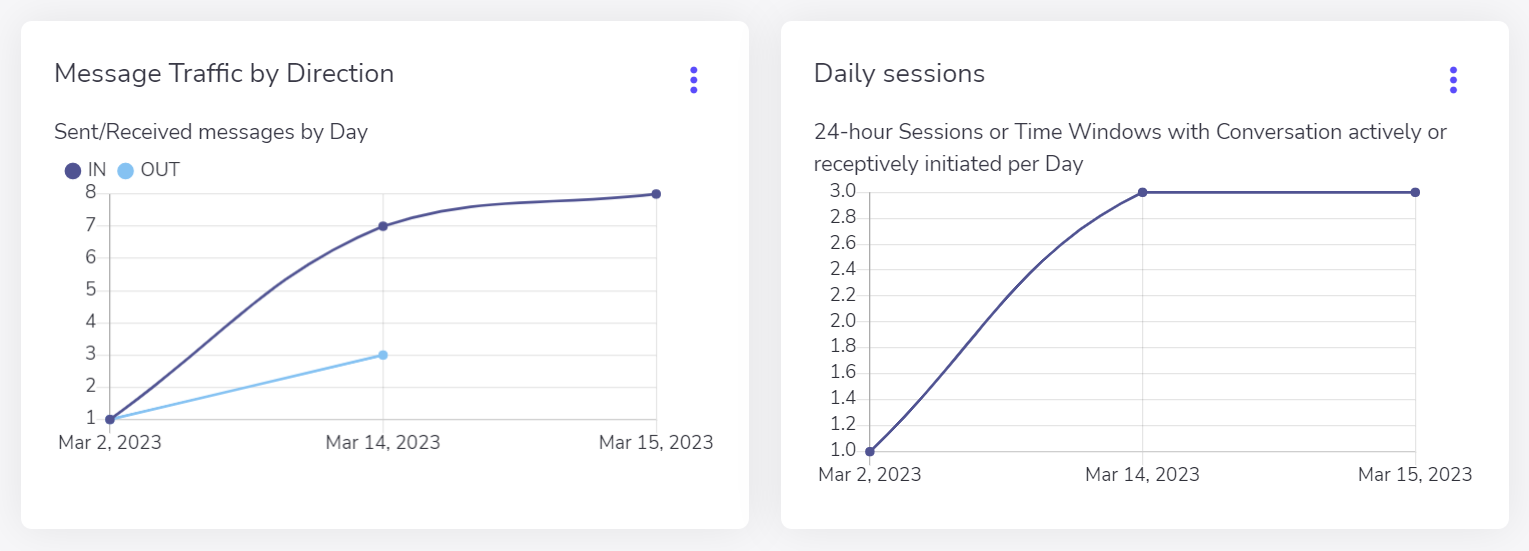
- Daily Message Traffic by Direction: Sent and received messages per day.
- Daily sessions: 24 hour windows or sessions with actively or receptively started conversation per day.
💡 Tip: To view specific data for a part of some indicator, simply hover the mouse cursor over the chart. A small pop-up shows details regarding the selected interval.
It is important to note that the Analytics Panel is not updated automatically. Below we show you how to update the data.
Updating data
To perform a manual update of all data, press Update data at the top of the dashboard.
In addition, you can also manually update specific indicators. To do this, click the button 
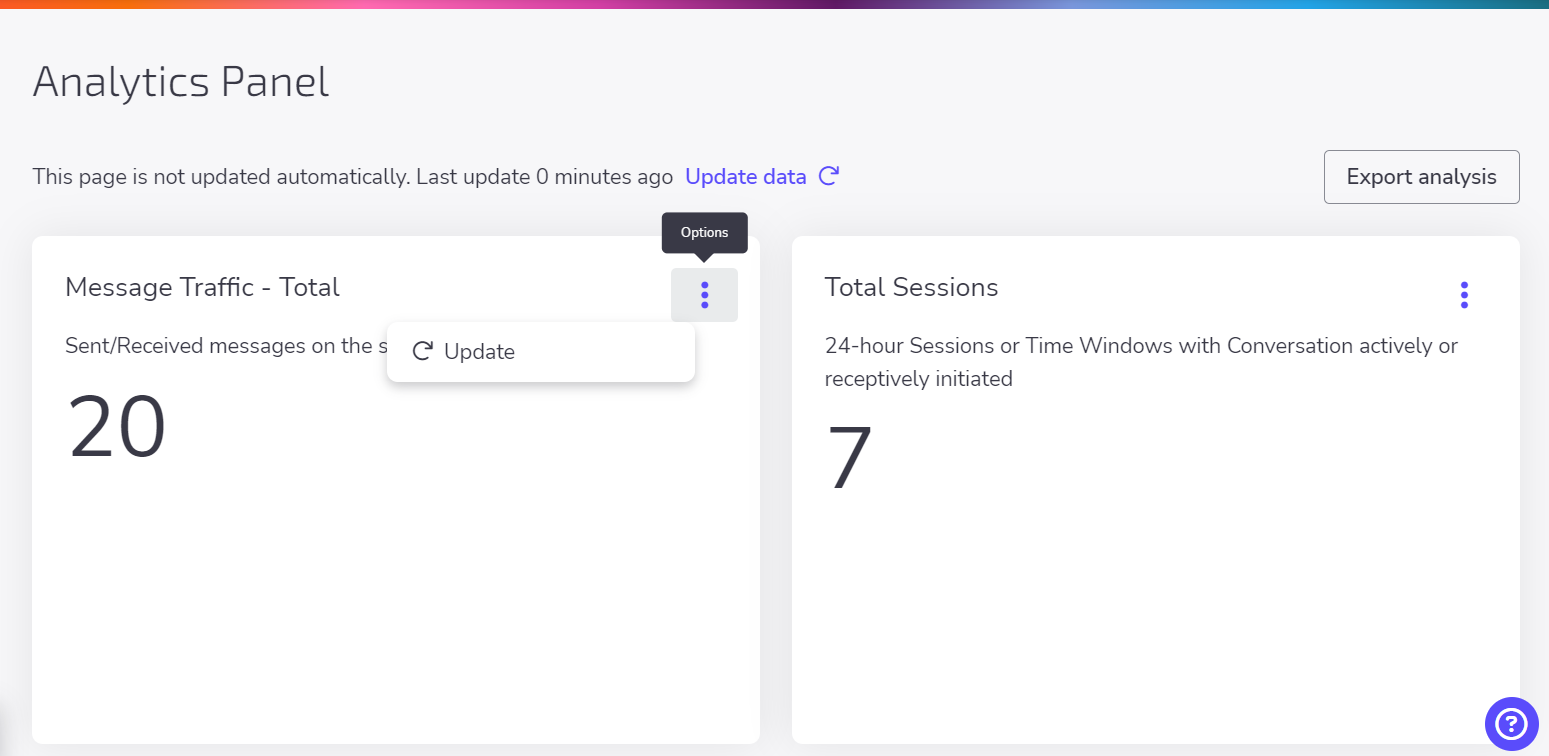
Next, here is how to export all the data presented in the Analytics Panel.
Export Analysis
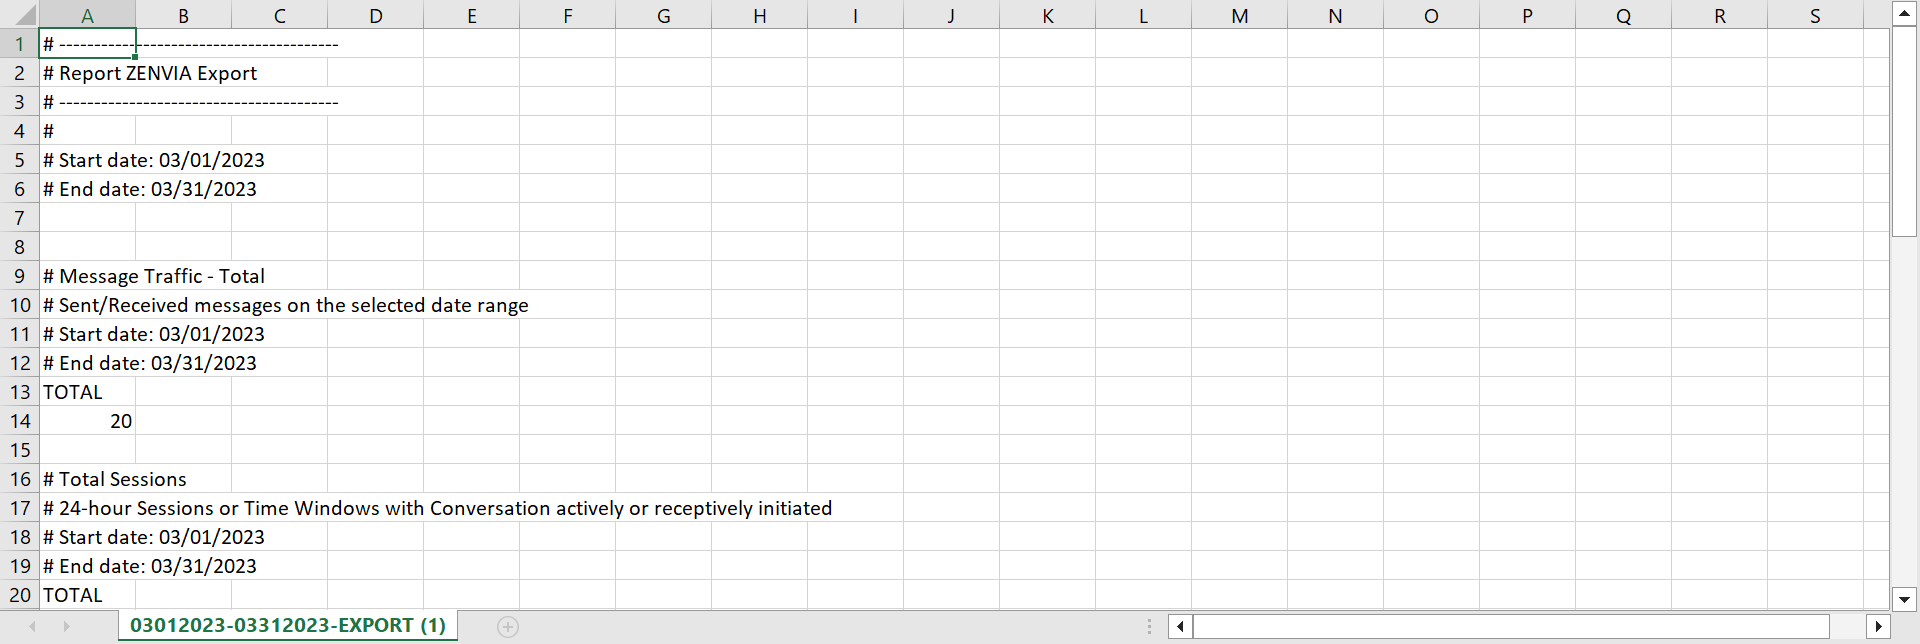
You can export the data presented in the Panel to a .csv file. CSV is a file format that stands for "Comma-Separated-Values", meaning that data fields in this format are usually delimited by a comma.
After selecting the time interval and filtering the desired products and/or channels for analysis, click Export Analysis > Download spreadsheet csv to download the file.
The file is saved in your default Downloads folder.
Done! Now you know how to use the Analytics Panel, interpret the indicators, and export analysis reports.