The New Contacts and Conversations Report is a feature of Zenvia Conversion that shows the metrics from contacts and conversations conducted in customer service Chats.
Filter the data by groups and by time period to analyze in detail the metrics of the Chats module, such as response time and your teams' interactions with contacts.
How to Analyze New contacts and conversations
To access this feature, simply go to Reports > New contacts and conversations. All metrics have alongside them the comparison of this number in real-time with previous periods.
💡 Tip: You can filter to view information for the following periods: Today, Yesterday, last 7 days, last 30 days, This month, Last month, and Custom.
See what each graph represents:
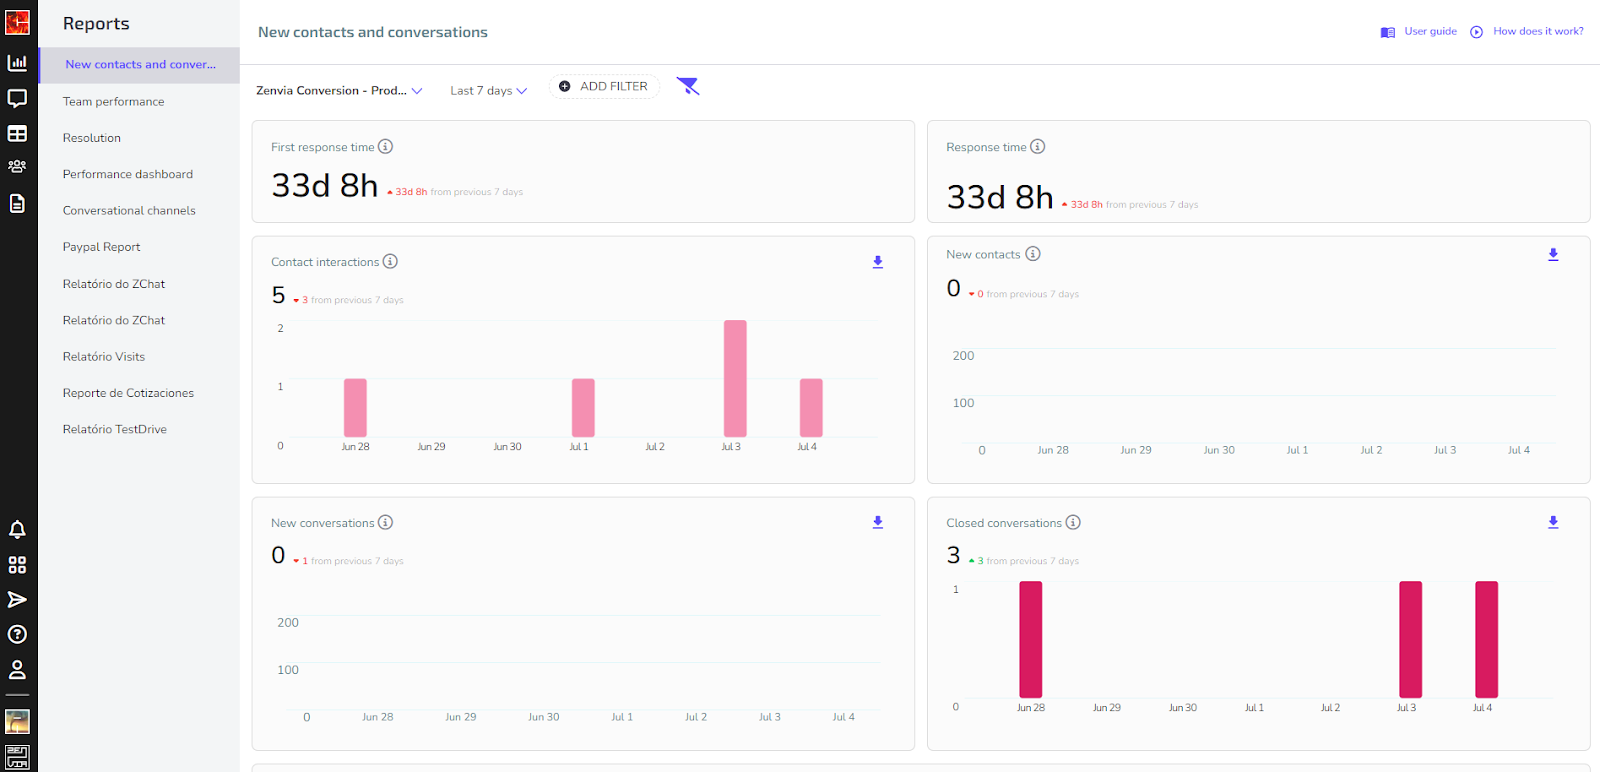
First Response Time
The First Response Time is a median of the time your team takes to respond to a new contact. The metric is the calculation of the time from the creation of a contact (who sent a message to your company) to the first response from an Agent user.
This metric does not consider users who are outside of business hours, nor quick responses or responses from the bot flow.
Response Time
This is the median time that the team in general takes to respond to a contact whose conversation is already open, calculating not only the first response but each time there is a contact with the same user.
This metric disregards business hours and the time of automatic responses. We use the median instead of the average so that our metrics represent the work of your team.
Interactions with Contacts
In this metric, you see the number of contacts your team interacted with per day during the selected period.
If a user interacted with a contact more than once on the same day, only one interaction will be counted. And if they interacted with a contact more than once on different days, one interaction per day will be counted. The final number is the sum of the daily values.
New Contacts
Here you see how many contacts were created during the selected period.
💡 Tip: To analyze other dates, simply change the time filter.
New Conversations
Compares the performance of each contact origin by the number of started and closed attentions. A contact can have multiple attentions.
💡 Tip: The table is updated every hour with new information.
Closed Conversations
See how many conversations your team closed during the selected period. Conversations end when contacts are closed, archived, or transferred.
💡 Tip: Change the time filter to see other dates.
Origins
Analyze the performance of each contact origin by channel and by the number of started and closed conversations.
In this section, both leads created in the system and contacts that were excluded are counted.
If you filter by groups, the table displays the leads currently in that group.
Contacts Table:
Origins: informs the channel of origin, such as Webchat or WhatsApp.
New Contacts: Total of new contacts that came from this source.
Started: How many contacts your team initiated interaction.
Closed: Number of contacts with closed conversations.
💡 Tip: This table is updated every hour with new information.
Most Active Hours
This graph is a heat map that shows the days and hours with the most active conversations. With these metrics, you can better distribute your team's working hours.
The information is not updated in real-time, and the graph does not consider the date when contacts were created, but rather when there is a higher number of conversations.