Overview is a report available in the Sales module of Zenvia Customer Cloud. It provides a complete overview of your team's interactions, bringing together key metrics about the service conversations, users, and contacts in your account.
To access this feature, go to Sales > Overview.
💡 Tip: You can download each section of the report in CSV format for external analysis.
Available metrics in the Overview
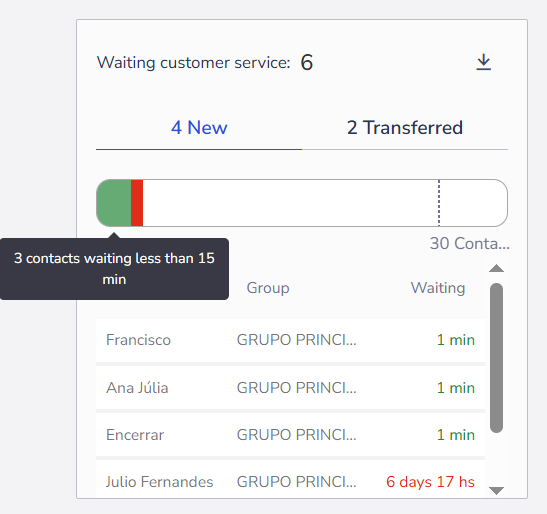
1. Waiting contacts
This section works as a visual thermometer, indicating how many contacts have not yet been answered by an agent.
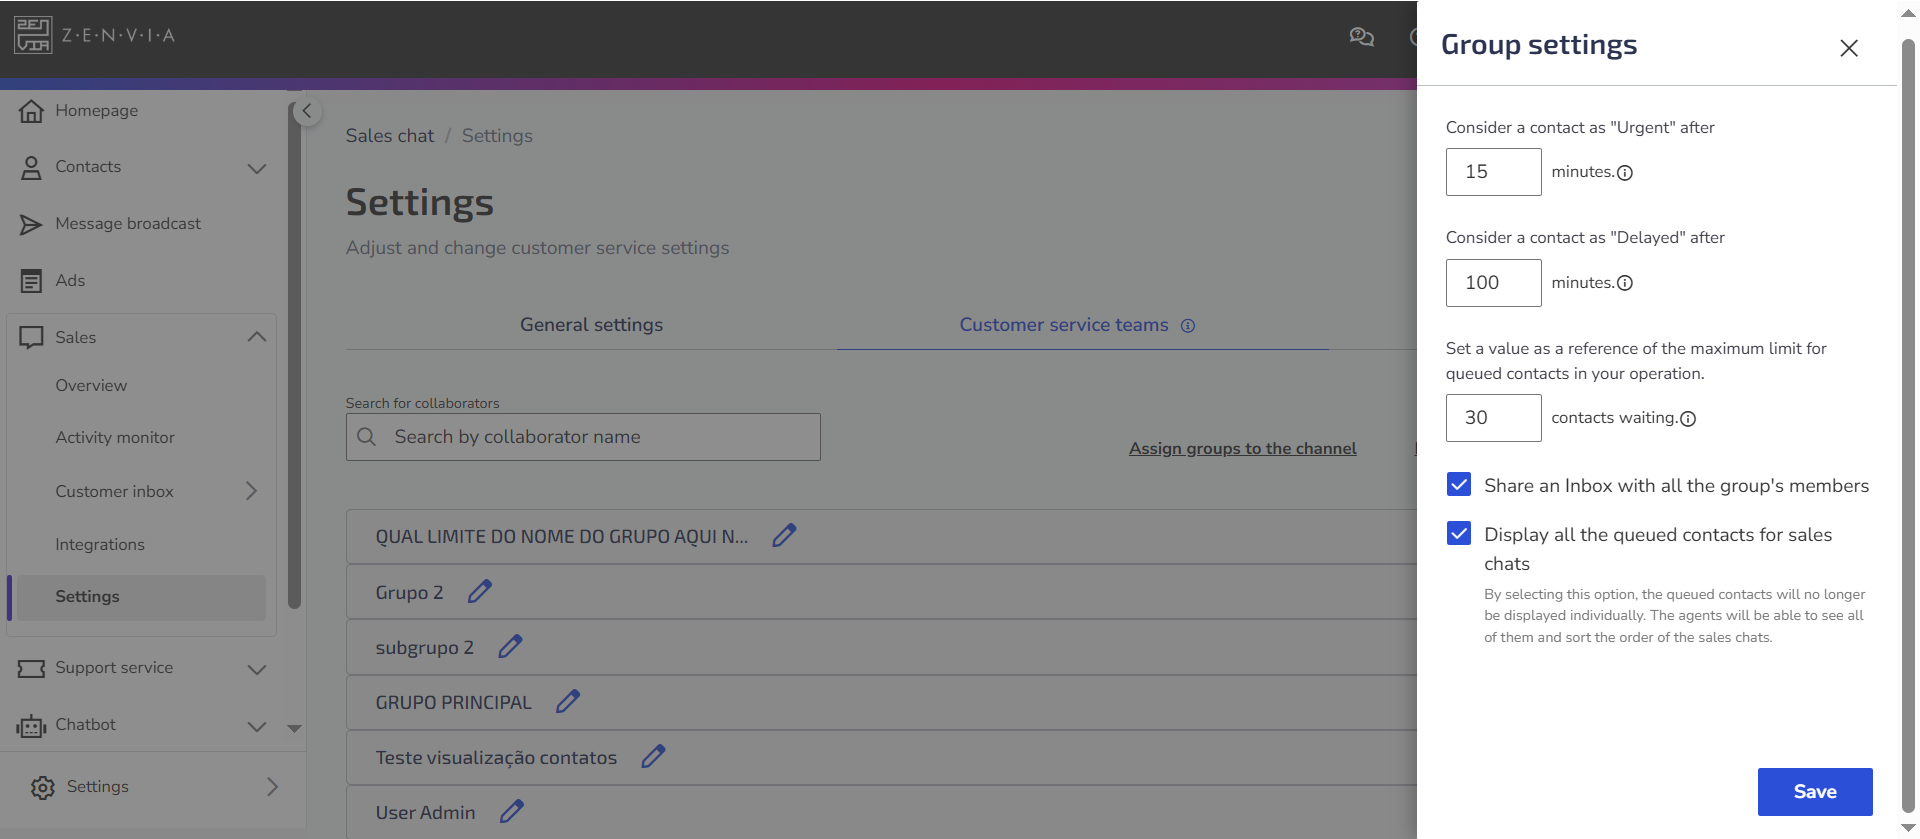
The colored bar represents the waiting time based on the parameters defined in the service group (under Sales > Settings > Customer service teams > Group settings).
🟢 Green: Contacts waiting less than the time limit defined as "urgent".
🔴 Red: Contacts waiting more than the time limit defined as "delayed".
The Contacts line represents the maximum number of contacts in queue defined for the operation. The colored bars (green or red) grow towards this line as the number of unanswered contacts increases.
The New column shows newly arrived contacts in the inbox who haven’t yet interacted, including data such as the contact name, assigned group, and waiting time.
The Transferred column shows contacts that have been redirected to another agent, with similar information (name, group, and waiting time).
2. First response time
Displays the average time your team takes to respond to a contact for the first time, based on the last 7 days.
This metric does not consider periods outside business hours or automated messages (such as quick replies or bot interactions).
3. Live activities
Displays real-time actions being performed in the operation, such as messages sent by agents and other inbox interactions.
This panel is ideal for monitoring team pace and productivity during business hours.
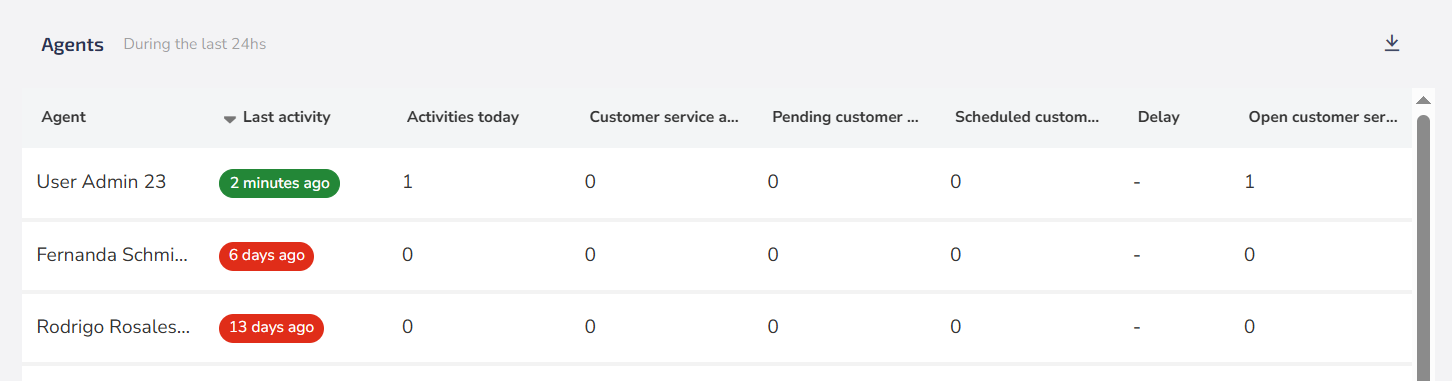
4. Agents
Provides a summary of each agent’s activity over the last 24 hours, including:
- Last activity: Shows how much time has passed since the user's last action (in seconds, minutes, hours, or days);
- Today's activities: Total number of interactions performed;
- Accepted conversations: Number of conversations accepted during the day;
- Pending conversations;
- Scheduled conversations;
- Time to respond: Total wait time before contacts were answered;
- Open conversations: Conversations that have not yet been closed.