Track activities and results to understand how your organization is operating. Go to Homepage to, in one place:
- Evaluate the impact of integrations with management systems.
- Monitor sales and service performance.
- Make fast, data-driven decisions to improve business and operational results.
These data combine internal usage insights (mass messaging, sales, and support interactions) and, when available, information from integrated external management systems.
⚡ Quick actions to make your work easier Use the shortcuts on the home page to access strategic functions. If you have questions, check out the materials below: Integrate system: Connect your business management system and get detailed insights about sales and customers. Send messages: Create and schedule campaigns, notifications, and promotions via SMS, WhatsApp, RCS or E-mail. Manage contacts: Create, edit, and organize contacts and lists. Activate channel: Connect channels and expand your reach. See invoices: Check payments and financial information. |
Data enabled by integration
The sections below are only available when your organization has an integrated and active management system in Zenvia Customer Cloud. After integration, data may take up to 24 hours to be displayed. Therefore, if there is no integration, the data will not be shown.
↳ Customer panel
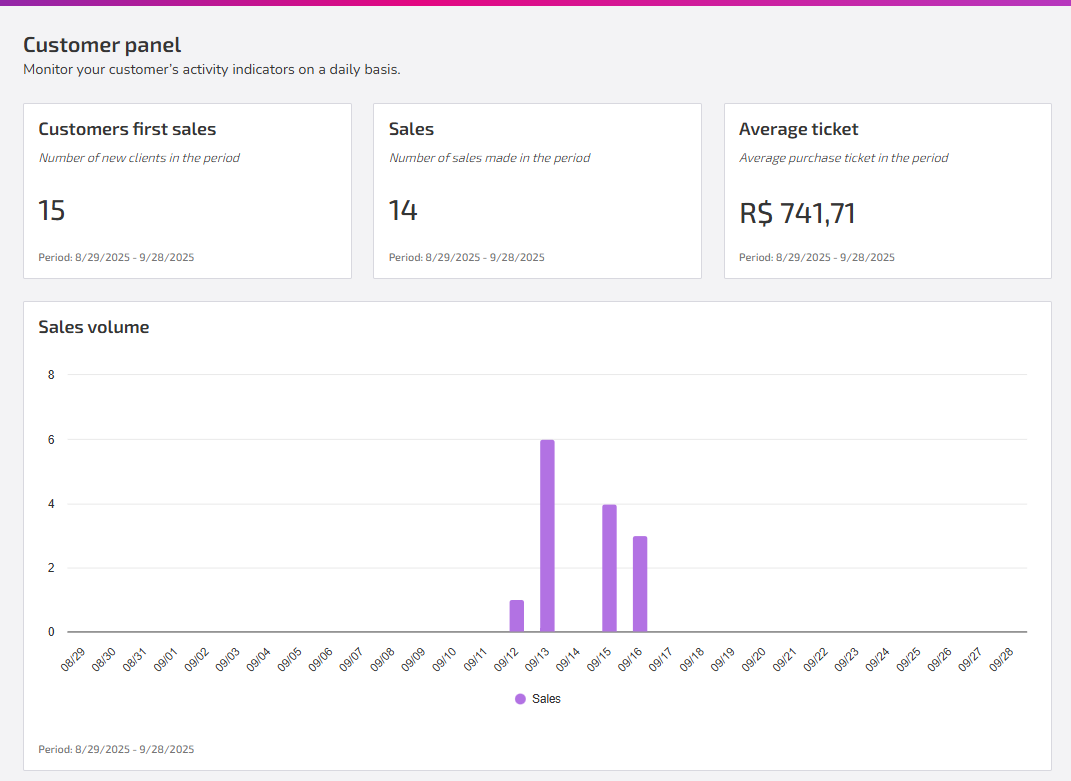
Shows business indicators that help you understand purchasing behavior and sales performance. In summary, it provides a consolidated view of how many new customers you acquired, total sales, average purchase value, and how these sales evolved over time:
Customers first sales
Total number of customers who made their first purchase during the period – evaluates new customer acquisition.
Sales
Total number of sales completed – measures the volume of business generated.
Average ticket
Average amount spent per purchase in the selected period (shown in the configured currency) – helps to understand the quality of sales.
Sales volume
Bar chart showing daily sales variation – identifies trends and demand peaks.
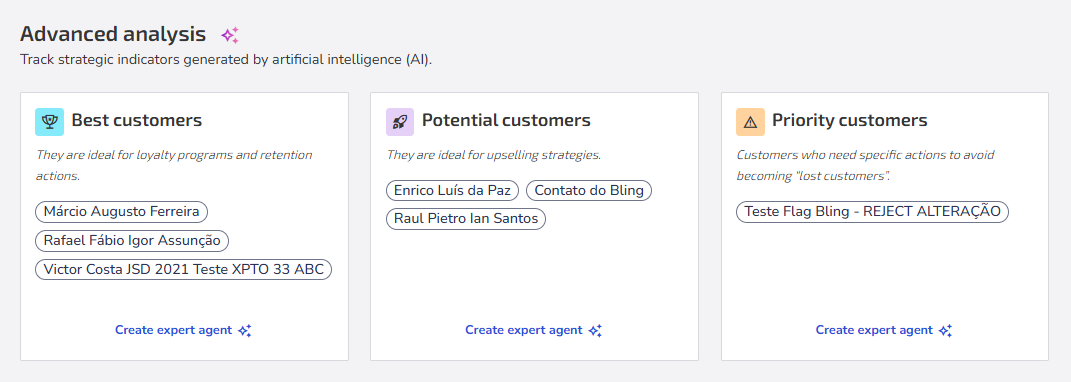
↳ Advanced analysis
Provides a segmented view of customers based on purchasing behavior, generated by Zenvia Customer Cloud's artificial intelligence (AI). It is ideal for targeting campaigns and sales strategies:
- Best customers: Those who purchase the most and generate the highest revenue.
- Potential customers: Show increasing interest and are good candidates for incentives.
- Priority customers: Require special attention to maintain the relationship or for reactivation.
💡 Tip: For each advanced analysis view, there is a pre-configured specialist agent. By clicking Create expert agent, you can quickly activate an agent ready to send personalized campaigns according to each customer profile, helping increase your sales without starting from scratch.
Operational performance data
This section displays indicators on the usage of Zenvia Customer Cloud resources, allowing you to monitor operational efficiency.
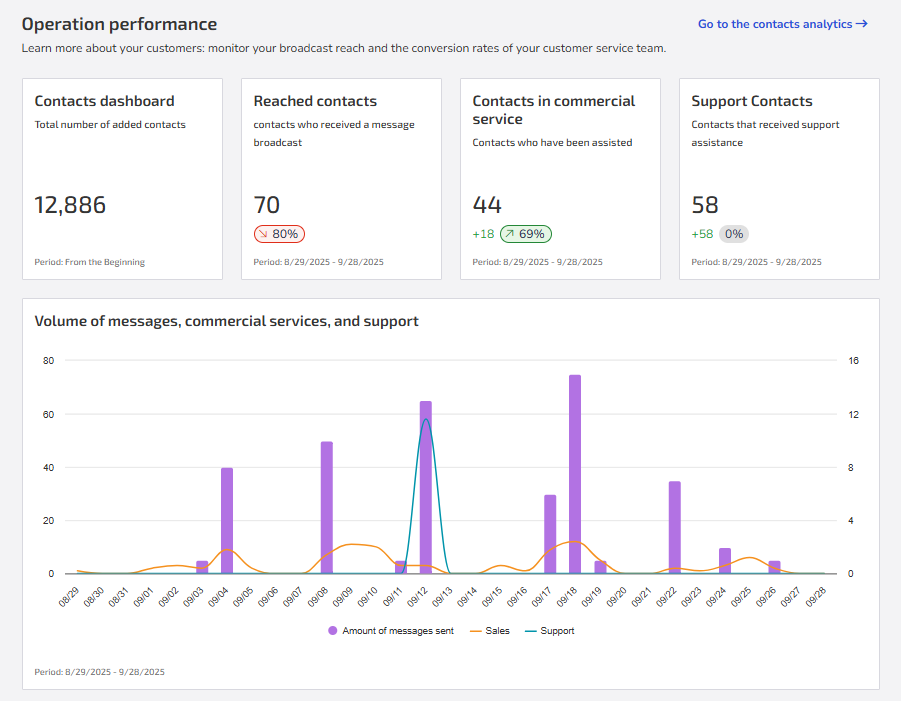
Contact dashboard
Total contacts added. Includes all customers or leads entered into the system.
Reached contacts
Contacts who received at least one message in the last 30 days. Includes a comparison with the previous period, indicating absolute and percentage changes. This helps understand the reach of communication campaigns.
Contacts in commercial service
Contacts who received any commercial service (e.g., sales or commercial inquiries) in the last 30 days. Also shows a comparison with the previous period, allowing analysis of commercial interaction performance over time.
Support contacts
Contacts who were assisted by the support team in the last 30 days. Also presents a comparison with the previous period, helping to monitor the volume and efficiency of support interactions.
Volume of messages, commercial service and support
Daily evolution of interactions based on the volume of messages sent (SMS, WhatsApp, E-mail, etc.) and how many of these contacts were assisted in commercial or support scenarios over the last 30 days.
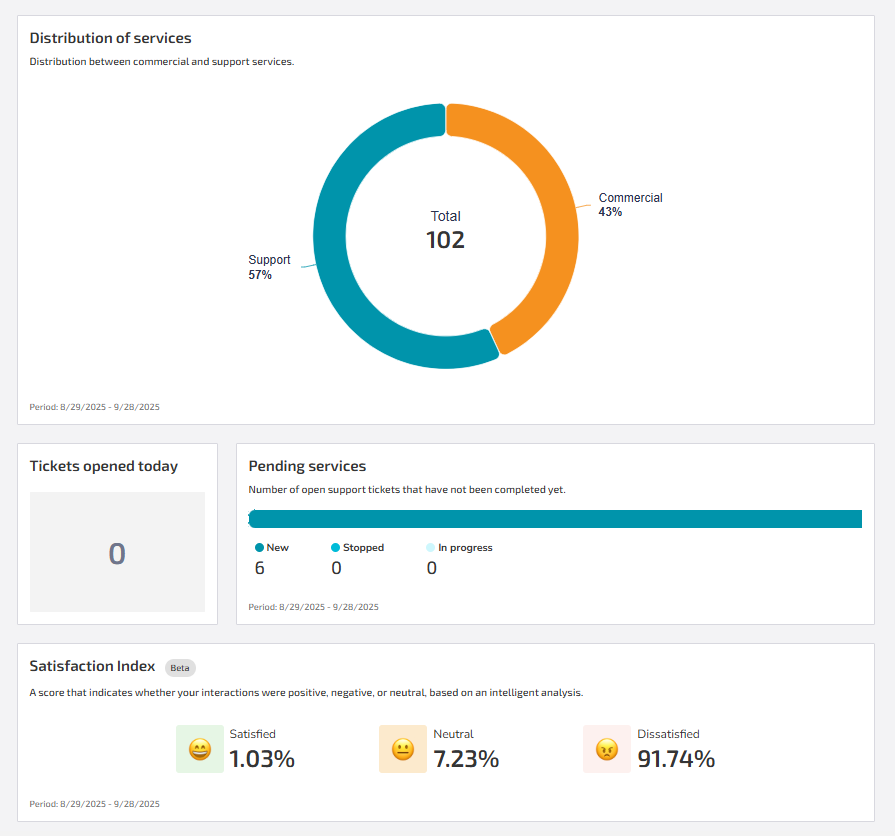
Distribution of services
Proportion of commercial and support interactions performed in the last 30 days, allowing you to understand the workload between these two areas.
Tickets opened today
Number of tickets (support requests) opened on the current day. Helps monitor the load of new tickets reaching the support team.
Pending service
Number of support interactions not yet completed in the last 30 days, including new, paused, and in-progress interactions. Helps monitor support flow and identify potential bottlenecks in problem resolution.
Satisfaction index
Overall evaluation of interactions with your contacts, indicating whether they were positive, negative, or neutral. The score is generated using Artificial Intelligence, based on the analysis of interaction content and not on formal satisfaction surveys related to support services.